Welcome to OSMTimeLapseR.
OSMTimeLapseR is an R package that helps you visualize the edits to OpenStreetMap (OSM) in various parts of the world. OSM is a volunteer-contributed map of the world (just like Wikipedia), and lots of people have spent a lot of time making the map in their communities better. OSMTimeLapseR helps them visualize and showcase that hard work.
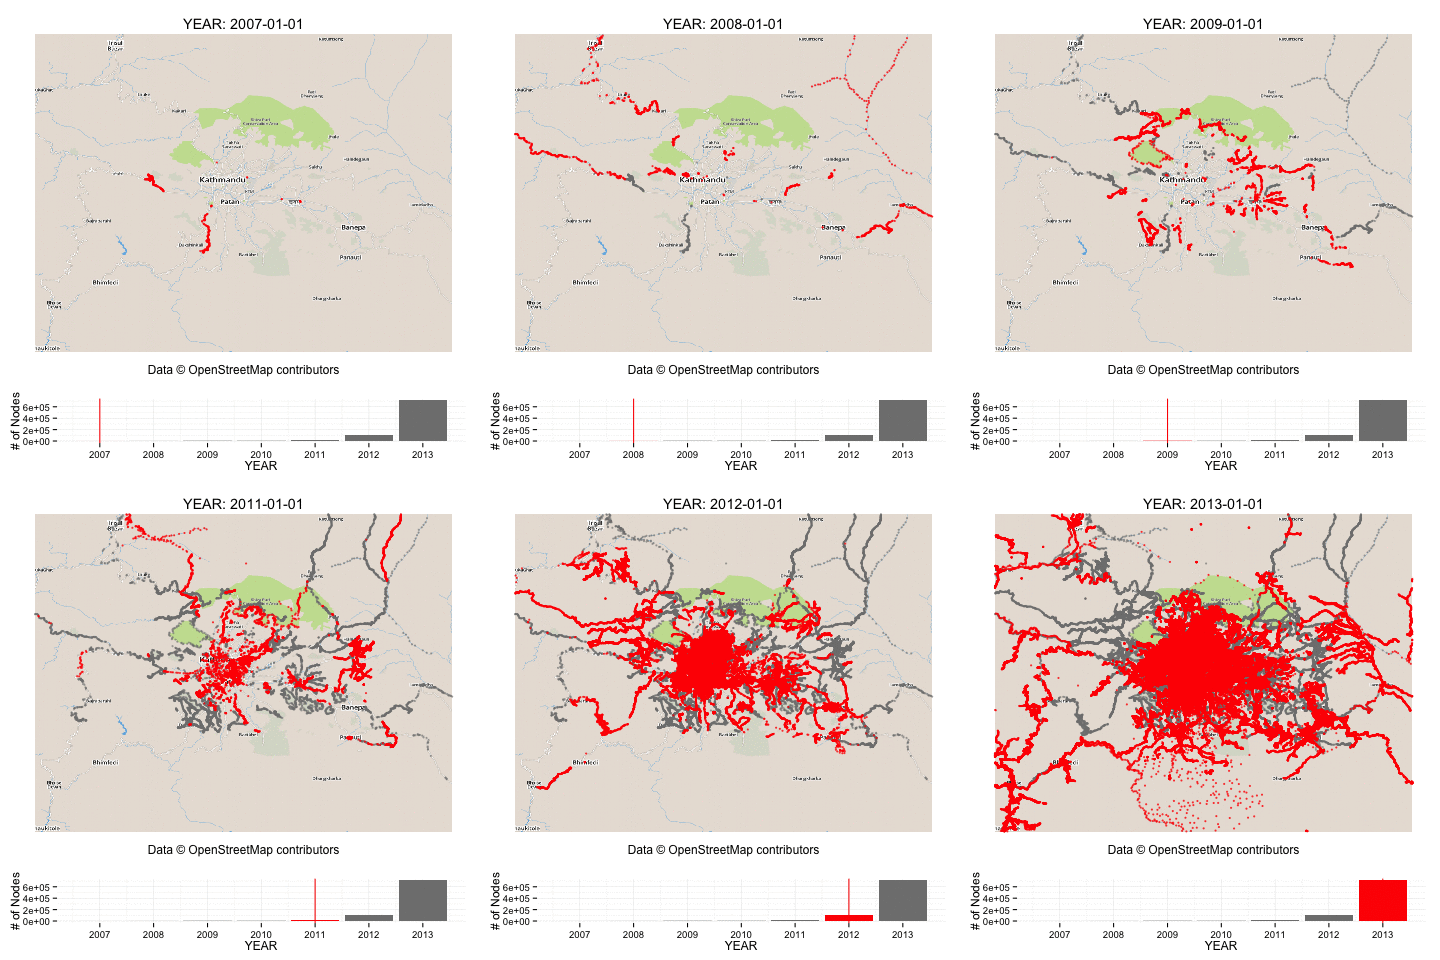
It was originally built for visualizing the hard work of the OSM community in Kathmandu, Nepal, where contributions in OSM have totally exploded in 2012 and 2013. In addition to looking at how OSM has grown in Kathmandu below, we hope that you follow the Examples listed on the left-hand side of this page to create visualizations of growth in your own community!

A monthly visualization is here.
Create your own
- Get started with producing visualizations with the OSMTimeLapseR package by following the Your first GIF and Your first HTML visualization examples. These use the data for Kathmandu from 2013, which is bundled with the OSMTimeLapseR package. Just by copying and pasting code, you’ll be able to re-create the visualizations you see on this webpage!
- To work with your own datasets, see the Make a GIF with your own data tutorial. We download data from Sochi, Russia, but you can use any .osm file you have access to.
- If you want to go beyond the red/grey dot-based visualization, you can create your own custom visualization. See the Creating Custom Visualizations examples for how to do that.
Caveat: For those who are keeping track at home, we are visualizing only the last change on nodes that are not deleted on OSM. This turns out to be an okay representation of reality for Kathmandu, but you may want to check assumptions if you make visualizations for a different community..
Installation instructions
- Install R (Mac, Windows, Other). I also recommend installing RStudio.
- Install Rtools (if you did not install the complete package).
- Install OSMTimeLapseR by typing the following in your R console:
install.packages('devtools'); require(devtools); install_github("prabhasp/OSMTimeLapseR")
- Install Java (required by R’s
OpenStreetMappackage). - If you want to work with your own files, install osmconvert
- If you want to make GIFs, install ImageMagick
Credits
- This work wouldn’t exist without the work of the OSM volunteers in Nepal and the incredible work they have been doing. All inspiration is drawn from them.
- Mike Migurski’s Metro Extracts and osmconvert have helped this work along greatly.
- This work owes quite a bit to the R software world, including Hadley Wickam’s packages (which make R pleasant to work with) and Yihui Xie’s animation package.
- Thanks to Robert Banick, Nama Budhathoki, Nate Smith, Robert Soden, Daniel Wood and others from the OSM community for early stage feedback and encouragement.